Web Analytics
Overview
In
today’s technology and information driven world, simply having a website or
social media page is no longer enough for companies to have. Marketing teams
now need to be able to collect information on who, what, why and when people
visit their web page. The addition of web analytics has allowed companies to
collect this necessary information and create comparisons for better decision-making.
These
analytical tools allow marketers to have crucial decision affecting information
right at their fingertips. The statistics that are collected help companies
understand where their strengths and weaknesses are, and can bring to light
areas that could become a strength for the company.
Google
Analytics
Currently the
number one most used analytical tool online is Google Analytics. This tool has
an estimated 29.3 million websites being tracked (McGee, 2015). While this does
not make up a large portion of the active websites around the world, it is a
significant amount, considering not all websites use analytical tools.
Google analytics offers both free
and paid versions of their software (Matteson, 2013). The tool currently offers
its users the ability to customize tracking, create detailed segments, set
goals, monitor conversion, campaign tracking, a customizable dashboard and so
much more (Google Analytics, 2016). All of these metrics and tools have made
Google Analytics the preferred analytical software for website users.
Clicky
One of Google’s
competitors in this market is Clicky Web Analytics. While they do not have the
same user level as Google Analytics, Clicky has over a million websites
currently using their system. Clicky provides its customers with real time
reports and metrics, an enormous amount of detail, information on individual
visitors and their actions, the ability to filter out bots and referrer spam,
heat maps and many more tools (Clicky, 2016).
A cool feature
that is offered by Clicky is there uptime monitoring which uses five different
geographic locations to monitor your site to make sure it never goes down. Clickly
currently provides tools that are not available on Google, which makes it an interesting
competitor to Google Analytics.
Comparison
(See
Appendix 2 for complete comparison breakdown)
Differences
While the
fundamentals of web analytics remain very similar, there are key differences
between Clicky and Google Analytics offerings. The interesting part about
differences in web analytics software is that its not clear cut that one
software is better than another. It all depends upon personal preference and
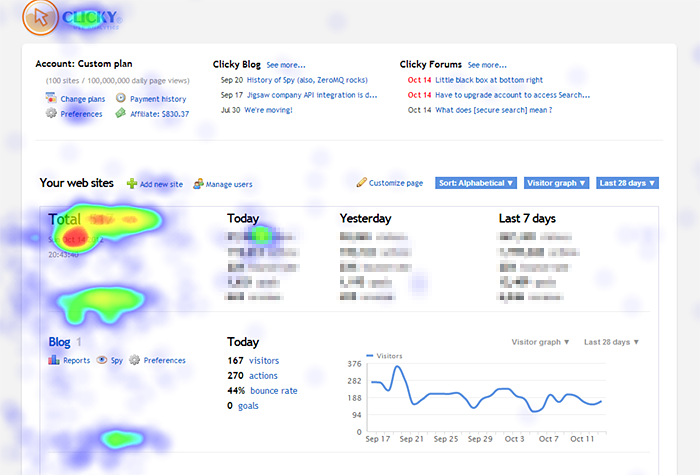
what the company’s goals and mission is. For example, Clicky currently offers a
heat map feature that shows where visitors click on a page and where their
courser spends the most time.

This feature is
something that can be extremely helpful to a company who’s online sales are
suffering and need a better explanation as to why it is happening. This feature
may not be as useful to a company who is not having the same conversion issues.
They may be more focused on increasing reach and traffic. The company that is
having conversion issues will like the ability to analyze heat maps in order to
identify if the layout or presentation of their page draws the visitors
attention away from the product being sold. The marketing team will be able to
identify areas that need to be adjusted or corrected and will be able to monitor
the changes on the heat map to gauge its effectiveness.
Another
great feature offered by Clicky, is the previously mentioned Uptime Monitoring.
This is something that most companies, especially those involved in ecommerce,
would find immensely helpful. This tool monitors the webpage from five
different geographic locations to make sure that your site does not go down. If
there is a significant outage, the user is notified through email and text if
set up through their account. This allows companies to make sure they are never
losing business due to a technical issue. Back in 2013, it was estimated that
Amazon lost $4.8 million due to their website being out for just 40 minutes (Soper,
2013). This is a major company that has full time tech support. Now imagine a
small business that has probably one person that handles their technology, with
any service other then Clicky they would have to be online in order to find out
about their outage.
Many
companies now post videos on their sites, whether commercials or informational.
The problem that companies currently have is they only have the ability to
monitor how many visitors watched the video until the complete end. This means
that the video could be 99% watched by almost all visitors and the company may
never realize its success. Clicky, unlike Google Analytics, offers video
analytics which tells the user more then just the number of complete views on
their video. Statistics such as average/total time spent watching, average time
before pause and how many viewers watched the entire video without stopping (Clicky,
2016). This information informs the company on their videos ability to keep the
viewers attention. These metrics will notify the marketing team if there is a
part in the video that is not reaching the viewers.
Similarities
The
differences in these systems will seem major for some users but it will all
depend on the goals and missions of the marketing team. While there are
differences in these systems, they both do maintain a lot of the same
fundamental information. The most basic feature that will be important to all
users is the fact that both systems are very customizable. Clicky and Google
Analytics both allow their users to customize how their data is presented to
them. From the segments that get compared to the default metrics that are shown
on the front dashboard are all available from both of these tools. This is
crucial for all users because being able to easily see the information that is
important to your company and separate the less important metrics out makes the
entire process less cumbersome.
One
of the main reasons that companies use analytical tools like Google Analytics
and Clicky is to monitor the success of their pages and campaigns. This means
that companies must set goals and be able to monitor them. These systems both
offer goal monitoring within their software. This allows the user to set
specific goals such as a certain number of unique visitors, and then monitor
how they are performing in terms of those goals. This is crucial for all
companies using this software because without the ability to identify if goals
are being reached, all this information just becomes a mash of numbers that do
not mean anything.
Conclusion
Google Analytics
has a giant lead in market share in this industry but that does not mean it is
the only viable option within the market. Analytics monitoring is very similar
to many other things in life where personal preference trumps industry standards.
One consumer may enjoy their steak at the five star restaurants in the city and
their neighbor may prefer to have an $8 cheeseburger from the bar on the
corner. Everyone and every company have different goals and objectives as well
as different taste and preferences. This means that when in the process of
deciding which tool to you, choosing #1 just because it is top of the market
may not be the best decision for your company.
References
Google Analytics. (n.d.). Retrieved November 5, 2016, from https://analytics.google.com/analytics/web/#report/defaultid/a86504758w128748860p132539003/
Help » Video and audio tracking | Clicky. (n.d.). Retrieved
November 05, 2016, from https://clicky.com/help/video
Matteson, S. (2013, January 02). Five things you should know
about Google Analytics - TechRepublic. Retrieved November 05, 2016, from http://www.techrepublic.com/blog/google-in-the-enterprise/five-things-you-should-know-about-google-analytics/
McGee, M. (2015, November 25). How Many Websites Use Google
Analytics? Estimates Suggest 30-50 Million. Retrieved November 05, 2016, from http://marketingland.com/as-google-analytics-turns-10-we-ask-how-many-websites-use-it-151892
Real Time Web Analytics. (n.d.). Retrieved November 05,
2016, from https://clicky.com/
Soper, T. (2013, August 19). Amazon just lost $4.8M after
going down for 40 minutes. Retrieved November 05, 2016, from http://www.geekwire.com/2013/amazon-lost-5m-40-minutes/
Appendix 1
Figure 1- Heat Maps
Appendix 2: Google
Analytic Vs. Clicky Comparison Chart


No comments:
Post a Comment