Tuesday, November 15, 2016

Tableau

When working with any analytic tool, especially Google Analytics, it provides a great amount of information and metrics for the user. The issue for some marketers is how to process and look at this information. In order to process this information even more then what is default in Google Analytics, Google has partnered with the application Tableau.
            Tableau is the premier software on the market for data visualization. “Data visualization is, quite simply, the process of describing information through visual rendering” (Interworks, 2016). This software allows users to take the information that is collected in Google Analytics and transfer it into Tableau so it can be arranged and presented in the best way possible for the company.
            Tableau has a number of great features that companies could use, including mapping (see appendix below for screen shots of Tableau features). This allows companies to create geographic maps that show specific locations of customers, sales, visitors, or any other information available. These maps can also be made into heat maps so the team can see areas, cities, or counties that have high population rates or high rate of their target market. Below is an example of the map and one example of how it can be used.
            Tableau offers great but simple features such as line graphs, bar graphs, and pie charts. These graphs allow for quick and easy access to the necessary information for the team. The advantage to using Tableau for these graphs is the ability to have complete control over appearance and the data that is filtered out. Filtering the data that is being shown is powerful because outliers can be removed from the data results. This allows companies to remove any large unusual data sources that could be throwing off their results. For example, if a company was looking at home values in New Jersey, they would be able to remove the sale prices in the shore area after Hurricane Sandy. This would allow them to remove the damaged area in which homes no longer existed and people were just selling the remaining land.
            Many large companies can contain data in a number of different systems and sometimes on different servers. Tableau allows their users to combine this information so they can cross-reference and analyze this data together. Being able to compare the best combination of data allows for most effective decision-making process. Larger companies have so much information at their fingertips that using a software like Tableau allows the necessary team members to easily organize and access all of the information it needs.
            After creating tables and graphs, Tableau allows users to create a dashboard. This feature allows the user to have multiple depictions on one single screen. The dashboard even allows the user to customize the dashboard with their branding and information. This means companies can make easy handouts and reports to be passed out at decision making meetings and for marketers it can be used in the sales pitch to a potential client.
            Tableau allows users to automatically connect their Google Analytic account to their Tableau software. This allows the information to continuously flow into Tableau and the user can easily refresh the data to get the up to date results. This is ideal for marketers to use if the data they are looking for is constantly changing. Being able to refresh the information without having to edit or add information to an Excel Spreadsheet.  Tableau is ideal for any company that is looking to save time in the data mining, forming, and analyzing process.
            An advantage that Tableau has over other applications is its ability to be customized. Tableau can be customized to look and appear in any matter that the user wishes. Users can add branding, change appearance for different mobile devices, and additions of color scheme and symbols. Tableau allows its users to create the dashboard then monitor to make sure that it will appear as desired on all devices. This is great for companies that will be sharing information between their marketing and management team. In today’s world, we are all always on the run and do not get the chance to check our desktop or laptop computer every minute. This allows the user to make sure if a team member is retrieving the data through the Tableau app, they are able to see the dashboard the way that the creator hoped for.
            While on the dashboard, users can add their company’s logo, slogan, tagline, or even a picture of their company office. Being able to add custom branding allows users to keep information for multiple clients, making it easier to identify which reports they are looking at. Also, branding is a great feature for using these reports as handouts at meetings, conventions, and other events. Being able to remove the Tableau branding and adding your own, makes companies feel like they are in complete control of their data and makes their handouts and appearance more professional.
            Graphs and charts can have any coloring system that the user wishes. This is great to keep with the branding theme as the user can make the graphs and charts appear in the colors of the company to help with its appearance and recognition. A great feature of Tableau is the ability to add custom shapes. This allows marketers who are evaluating an area or a market to assign a specific shape to certain results. For example, if a marketing team was trying to identify how many sports fields and pizza locations were in a certain city, they would be able to make the sports fields appear as a soccer ball and the pizza places appear as a pizza slice. This makes the ability of the viewer to absorb the data a lot easier.
            Overall, Tableau appears to be an unbelievably powerful tool that can help marketers in their process. Having this app attached to a web page, Google Analytics page can create quick, easy, and powerful reports for the entire marketing team. Using the actionable data available in Google Analytics along with the easy to view reports makes the decision making process of the team that much easier and more effective.

References


Why Tableau? Because it's the best Data Visualisation software out there. (n.d.). Retrieved November 08, 2016, from https://interworks.co.uk/business-intelligence/why-tableau/


Tuesday, November 8, 2016

Clicky.com VS. Google Analytics

Web Analytics Overview
            In today’s technology and information driven world, simply having a website or social media page is no longer enough for companies to have. Marketing teams now need to be able to collect information on who, what, why and when people visit their web page. The addition of web analytics has allowed companies to collect this necessary information and create comparisons for better decision-making.
            These analytical tools allow marketers to have crucial decision affecting information right at their fingertips. The statistics that are collected help companies understand where their strengths and weaknesses are, and can bring to light areas that could become a strength for the company.
Google Analytics
Currently the number one most used analytical tool online is Google Analytics. This tool has an estimated 29.3 million websites being tracked (McGee, 2015). While this does not make up a large portion of the active websites around the world, it is a significant amount, considering not all websites use analytical tools.
            Google analytics offers both free and paid versions of their software (Matteson, 2013). The tool currently offers its users the ability to customize tracking, create detailed segments, set goals, monitor conversion, campaign tracking, a customizable dashboard and so much more (Google Analytics, 2016). All of these metrics and tools have made Google Analytics the preferred analytical software for website users. 
Clicky
One of Google’s competitors in this market is Clicky Web Analytics. While they do not have the same user level as Google Analytics, Clicky has over a million websites currently using their system. Clicky provides its customers with real time reports and metrics, an enormous amount of detail, information on individual visitors and their actions, the ability to filter out bots and referrer spam, heat maps and many more tools (Clicky, 2016).
A cool feature that is offered by Clicky is there uptime monitoring which uses five different geographic locations to monitor your site to make sure it never goes down. Clickly currently provides tools that are not available on Google, which makes it an interesting competitor to Google Analytics.
Comparison  
(See Appendix 2 for complete comparison breakdown)
Differences

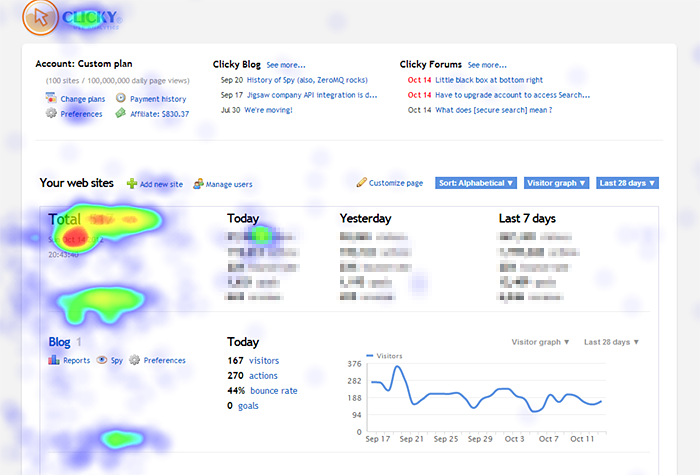
While the fundamentals of web analytics remain very similar, there are key differences between Clicky and Google Analytics offerings. The interesting part about differences in web analytics software is that its not clear cut that one software is better than another. It all depends upon personal preference and what the company’s goals and mission is. For example, Clicky currently offers a heat map feature that shows where visitors click on a page and where their courser spends the most time.
This feature is something that can be extremely helpful to a company who’s online sales are suffering and need a better explanation as to why it is happening. This feature may not be as useful to a company who is not having the same conversion issues. They may be more focused on increasing reach and traffic. The company that is having conversion issues will like the ability to analyze heat maps in order to identify if the layout or presentation of their page draws the visitors attention away from the product being sold. The marketing team will be able to identify areas that need to be adjusted or corrected and will be able to monitor the changes on the heat map to gauge its effectiveness.
            Another great feature offered by Clicky, is the previously mentioned Uptime Monitoring. This is something that most companies, especially those involved in ecommerce, would find immensely helpful. This tool monitors the webpage from five different geographic locations to make sure that your site does not go down. If there is a significant outage, the user is notified through email and text if set up through their account. This allows companies to make sure they are never losing business due to a technical issue. Back in 2013, it was estimated that Amazon lost $4.8 million due to their website being out for just 40 minutes (Soper, 2013). This is a major company that has full time tech support. Now imagine a small business that has probably one person that handles their technology, with any service other then Clicky they would have to be online in order to find out about their outage.
            Many companies now post videos on their sites, whether commercials or informational. The problem that companies currently have is they only have the ability to monitor how many visitors watched the video until the complete end. This means that the video could be 99% watched by almost all visitors and the company may never realize its success. Clicky, unlike Google Analytics, offers video analytics which tells the user more then just the number of complete views on their video. Statistics such as average/total time spent watching, average time before pause and how many viewers watched the entire video without stopping (Clicky, 2016). This information informs the company on their videos ability to keep the viewers attention. These metrics will notify the marketing team if there is a part in the video that is not reaching the viewers.
Similarities
            The differences in these systems will seem major for some users but it will all depend on the goals and missions of the marketing team. While there are differences in these systems, they both do maintain a lot of the same fundamental information. The most basic feature that will be important to all users is the fact that both systems are very customizable. Clicky and Google Analytics both allow their users to customize how their data is presented to them. From the segments that get compared to the default metrics that are shown on the front dashboard are all available from both of these tools. This is crucial for all users because being able to easily see the information that is important to your company and separate the less important metrics out makes the entire process less cumbersome.
            One of the main reasons that companies use analytical tools like Google Analytics and Clicky is to monitor the success of their pages and campaigns. This means that companies must set goals and be able to monitor them. These systems both offer goal monitoring within their software. This allows the user to set specific goals such as a certain number of unique visitors, and then monitor how they are performing in terms of those goals. This is crucial for all companies using this software because without the ability to identify if goals are being reached, all this information just becomes a mash of numbers that do not mean anything.
Conclusion
Google Analytics has a giant lead in market share in this industry but that does not mean it is the only viable option within the market. Analytics monitoring is very similar to many other things in life where personal preference trumps industry standards. One consumer may enjoy their steak at the five star restaurants in the city and their neighbor may prefer to have an $8 cheeseburger from the bar on the corner. Everyone and every company have different goals and objectives as well as different taste and preferences. This means that when in the process of deciding which tool to you, choosing #1 just because it is top of the market may not be the best decision for your company.
References

Help » Video and audio tracking | Clicky. (n.d.). Retrieved November 05, 2016, from https://clicky.com/help/video

Matteson, S. (2013, January 02). Five things you should know about Google Analytics - TechRepublic. Retrieved November 05, 2016, from http://www.techrepublic.com/blog/google-in-the-enterprise/five-things-you-should-know-about-google-analytics/

McGee, M. (2015, November 25). How Many Websites Use Google Analytics? Estimates Suggest 30-50 Million. Retrieved November 05, 2016, from http://marketingland.com/as-google-analytics-turns-10-we-ask-how-many-websites-use-it-151892

Real Time Web Analytics. (n.d.). Retrieved November 05, 2016, from https://clicky.com/

Soper, T. (2013, August 19). Amazon just lost $4.8M after going down for 40 minutes. Retrieved November 05, 2016, from http://www.geekwire.com/2013/amazon-lost-5m-40-minutes/


Appendix 1

Figure 1- Heat Maps

Appendix 2: Google Analytic Vs. Clicky Comparison Chart


Sunday, October 30, 2016

Social Media Platforms

Businesses today can no longer rely on word of mouth or simple print ads in a newspaper to gain the attention of new customers. Social media has become almost a necessity for all businesses to retain their place in the market. In 2014 almost 50% of consumers looked to at least one social media page before making a purchase (Go Gulf, 2016).  This means the businesses need to use their presence on social media in order to be involved in their consumers buying process.
            It is very easy for a company to look at the demographics of one social media site and see that their target market is present there and decide to only use that site. This philosophy will lead the company to have a minimal presence on social media and could lead to missed opportunities. There are a number of solid reasons on why companies should use multiple sites and they begin with the fact that by using multiple sites you can reach a larger portion of your audience. For example, a company may see that a large portion of their target market uses Facebook so they focus solely on that. A portion of their target market may also be present on Instagram and this may make up a group of the market that is more willing and financially capable of buying your product or service. So by focusing on Facebook the company is loosing potential sales.
            Customer Service is a part of any business that may not affect a customer buying your product the first time but without a doubt will effect whether or not they purchase your product or service again. Having a presence on multiple social media sites allows a company to control the conversation. If a company is only present on Pinterest they might be missing negative comments customers are making on Twitter. By allowing customers to post their negative comments on Twitter without a response from the company, the customer is controlling the conversation and the viewer’s perspective of the incident. A company that is present and activate on the site would be able to respond and potentially lessen the impact of the comment. A company’s presence on multiple sites can improve customers’ opinion of the brand and thus increase the brand image.
            In todays world many companies live by the theory that if your competition does it then you must too. While this is definitely not always the best or smart option, but when it comes to social media sometimes it is the best option. If your competition is more active on sites that your company is not present on then they may be able to reach a part of the market that you cannot. This allows them to gain control of a sector that you are willingly giving them by not making your presence known on that network. In ultra competitive markets and industries, companies cannot afford to give away any portion of the market share in order to stay in business.
            The biggest reason that all companies should be using multiple social media sites is because every site has different strengths and weaknesses. All of these can affect conversation rates, brand image, and overall reach of a company. Facebook while having lower click-through rates on their advertisements, are the elite when it comes too remarketing and tracking (Reed College of Media, 2016). Facebook has mastered the process of making sure that page likes and clicks are recorded and follow the customers in forms of ads and post placement. This is great for companies who need to increase brand awareness and reach more customers. While many people do not recognize YouTube as a social media site, it currently has accounts for roughly 50% of all Internet users (Reed College of Media, 2016). YouTube is great for leading traffic to other sites or pages and provides a great analytics resource for its users to monitor its traffic and so much more. While companies might not see the need for YouTube, posting something as simple as a commercial, infomercial, or basic industry information can create a connection that the company did not previously have access too.
            Instagram provides companies an even bigger advantage now that it was recently bought by Facebook (Shontell, 2013). This acquisition allows companies to link their ads on both sites to help drive traffic. Linking the ads helps for marketing campaigns and allows companies to keep a consistent message across the sites, increasing the chances for brand recognition. One of the newest social media sites is also the fastest growing and that is Snapchat (Morrison, 2015). Snapchat is idea for companies to drive traffic as well as help build a brand image. Connecting to your consumers directly and providing an insiders look into the company is great for building brand loyalty. Companies can now use the story section of Snapchat to reach users that do not even follow them. This allows companies to contact the almost 60 million daily users of Snapchat (Kokalitcheva, 2016).
            Companies must take into account all of these factors when deciding whether they will use one, multiple, or all of the social media networks. Another statistic that will have to be considered in this decision making process is the frequency in which users visit these networks. Facebook and Instagram have more then 50% of their users who visit their site on a daily basis (Duggan, 2015). In comparison Pinterest and Linkedin have almost 50% of their users visiting their site less frequently then on a weekly basis. So it is not worth a company to post daily on sites such as Pinterest and Linkedin but they must on sites such as Facebook and Instagram.
            Using all of this information I believe that it is clear what a company must do in order to compete in today’s competitive market that is technology driven. Companies must be present on at least multiple social media networks in order to most effectively reach their target market. Reaching the target market, building brand awareness, brand loyalty, and increasing the overall brand image of a company can only be effectively and completely done by proper use of these networks.

References

Businesses on Social Media- Statistics and Trends [Infographic]. (n.d.). Retrieved

Duggan, M. (2015, August 17). The Demographics of Social Media Users. Retrieved
October 26, 2016, from http://www.pewinternet.org/2015/08/19/the-demographics-of-social-media-users/

Kokalitcheva, K. (2016, September 25). Snapchat’s Daily Active User Count Has
Surpassed a New Milestone. Retrieved October 29, 2016, from http://fortune.com/2016/09/26/snapchat-users-us-canada/

Morrison, K. (2015, July 28). Snapchat Is the Fastest Growing Social Network

Reed College of Media (2016). Week 3 lesson: Social Media Analytics & Advertising
Channels. West Virginia University. Retrieved from https://ecampus.wvu.edu/webapps/blackboard/execute/displayLearningUnit?course_id=_69901_1&content_id=_3398293_1&framesetWrapped=true

Shontell, A. (2013, May 09). How Instagram Co-Founder Kevin Systrom Spent His
Year After The $1 Billion Facebook Acquisition. Retrieved October 29, 2016, from
http://www.businessinsider.com/its-been-1-year-since-facebook-bought-instagram-for-1-billion-heres-how-co-founder-kevin-systrom-spent-it-2013-5